Oil & Gas: The Supply Response is Currently Broken
Investment in new oil & gas projects is woefully inadequate to meet the needs of the global economy
Companies are more focused on returning cash to shareholders than growing production
Long term demand for gas is likely to be stronger than for oil
09/22/2022
Executive Summary
Investors have largely shunned the oil & gas business since the fallout of the shale oil boom in 2014-2016 and for good reason. Oil and gas companies destroyed a lot of capital drilling unprofitable wells as Wall Street financiers goaded them into chasing production growth over profitability. Those days are gone (at least for now). Investors now cheer on energy firms that focus on efficiency and profitability to fund lucrative dividends rather than production growth. Policy makers and ESG advocates have created a strong incentive for firms to reduce carbon emissions and help deliver climate-focused objectives. The mechanism for supply response is currently broken. This all adds up to a lower supply of oil & gas supplies and much higher prices for the foreseeable future barring significant demand destruction. And most importantly for investors, record profits.
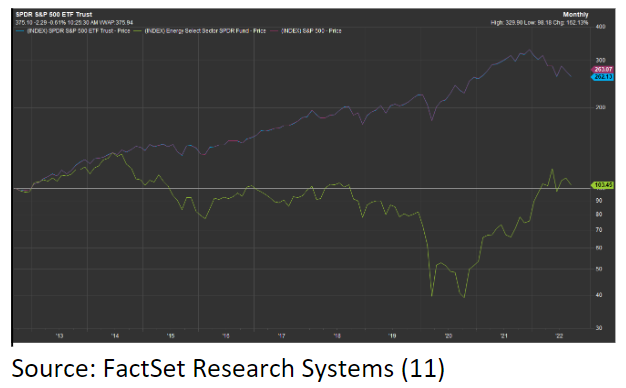
Disclosure: This blog does not constitute advice. This is not an offer to buy or sell securities. The material has The above chart shows the price returns for the energy sector (represented by XLE) compared to the S&P 500 (represented by SPY) for 10 years through market close 09/21/2022. Over that time, total returns (including dividends) for XLE was 49.8% vs a whopping 216.7% for SPY (11).
The period of June 30th 2014 to October 30th 2020 highlights the relative disparity. During that period, SPY produced total returns of 88.8% while XLE total returns were NEGATIVE 63.3% (11)! A difference of about 152%. By October of 2020, the conventional wisdom in the investment community was that investing in oil & gas was akin to lighting a flame to your cold hard cash.
The covid lockdowns in 2020 depressed demand for oil swiftly and sharply, leading oil prices to go negative for the first time in history due to a shortage of storage options. Oil companies were forced to shut in wells because there was nowhere to put the oil which created the conditions for future shortages. As lockdowns eased and routines started to normalize, oil companies were not able to bring back production fast enough (shut in wells can’t just be turned back with a flip of a switch). Now, the US is rapidly drawing on its oil reserves and both oil & gas production has been disrupted due to the war in Ukraine. As a result, the energy sector is flourishing.
From October 30th 2020 to August 31st 2022, XLE has produced returns of 203.4% vs just 24.1% for the S&P 500 (11).
In this blog post, we’ll argue that even after this impressive run, the sector remains a solid investment. The long-term demand profile for natural gas is much more robust than for oil, but we believe supply will remain constrained for both commodities for the next several years leading to an elongated period of bumper profits. We’ll also highlight the risks to this thesis (there’s always risk!)
Before investing, we always encourage our readers to consult a trusted financial professional regarding your personal financial situation and to do your own due diligence.
An Overview of the Oil & Gas Business
First, what are oil and gas used for?
Below is a breakdown of what a barrel of oil gets used for according to the University of Calgary (15). Gasoline and Heating Oil/Diesel generate roughly 2/3 of demand which are under threat from decarbonization efforts, but other uses should prove more resilient in the long term like jet fuel, lubricants, asphalt, and petrochemicals.
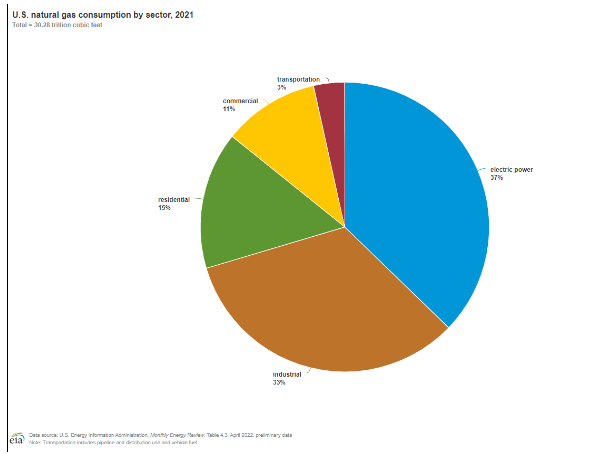
Natural gas demand looks quite different as one might expect. The pie chart illustrates the breakdown of natural gas usage in the US (16). Most natural gas domestically gets used for creating electricity, heating water & buildings, and to make things like chemicals, fertilizer and hydrogen.
The oil & gas business is organized in three distinct segments.
Upstream – The activity of extracting oil & gas from below the surface. These companies typically carry the most exposure to commodity prices and make money by selling at a higher price than it costs for them to produce.
Midstream – This is an infrastructure and transport business. These companies own pipelines that transport oil & gas from the field to where it is either refined into other products or shipped to another destination. The pipelines generally charge a fee to either the producer or the end user for the right to ship on their pipelines. Some charge a flat rate and some maintain commodity price exposure.
Downstream – These companies transform raw commodities into value-added products such as gasoline, diesel fuel, jet fuel, chemicals, plastics, etc. Commodity prices are a cost to downstream companies and they tend to add a premium for refining the commodity into various products.
Some companies are large enough to act as all three segments and are known as integrated oil & gas companies. This strategy is deployed as a partial hedge against volatile commodity prices and can help lead to more predictable (relatively speaking) profit margins than simply operating as upstream or downstream.
Supply & Demand Dynamics
Oil and gas are commodities, and so we must first consider the global supply and demand picture as well as forecasts. These commodities are relatively price inelastic (changes in price do little to impact demand) in the short run, so small changes in the balance can lead to relatively large swings in pricing. Further, most projects to develop new supply take several years (outside of shale) so it generally takes producers considerable time to adjust production to changes in demand.
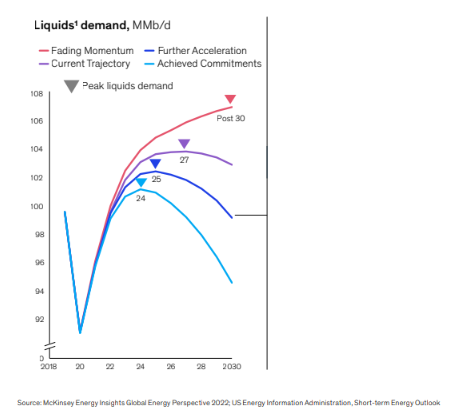
Projections for natural gas demand in the future is much more robust than for oil. According to McKinsey (8), global oil demand is likely to peak sometime in the 2020s before falling rapidly depending on the decarbonization scenario with electric vehicles expected to fuel most of that decline. Demand from plastics, chemicals, and aviation is expected to be much more resilient long term.
Natural gas demand, by contrast, is expected to continue to grow by at least 10% in the coming years before eventually declining due to decarbonization within buildings and industry (8). Natural gas is considered to be more of a bridge fuel. It’s burning emits less CO2 than oil and it makes for a nice complement to renewable energy for baseload electricity until enough battery storage can be developed. It is also useful in creating hydrogen, producing fertilizers and producing high heat necessary for industrial processes.
One might assume given the inevitable decline in demand that investment in the sector would be unwise. However, we also must consider the supply side of the equation. This is where things get interesting as we are in the midst of a massive shortfall in investment in new supply.
As stated by The Economist on 10/04/2021, “A rule of thumb is that oil companies are supposed to allocate about four-fifths of their capital expenditure each year just to stopping their level of reserves from being depleted. Yet annual investment by the industry has fallen from $750bn in 2014 (when oil prices were above $100 a barrel) to an estimated $350bn this year, reckons Saad Rahim of Trafigura, a commodity trader. Analysts at Goldman Sachs, a bank, say that over the same period, the number of years’ worth of current production held in reserves in some of the world’s biggest projects has fallen from 50 to about 25.” (6)
Investments in upstream oil & gas have, in fact, fallen substantially in recent years as illustrated by the IEA (10). What’s more, upstream investments in traditional fields have a lead time of several years before a long period of sustained and steady production. However, much of the investment in recent years have been allocated to shale projects which can produce hydrocarbons less than a year from drilling and deplete much faster. This means that recent supply additions will need even higher capital expenditure levels than we have observed historically just to sustain current supply.
Source: IEA
A major concern for investors is the idea that oil & gas companies could be left with substantial “stranded assets” because of the looming decline in demand. However, data from the International Energy Agency clearly shows that even in a sustainable development scenario, investment in new fields will be required to prevent large shortages in oil supply. (10)
Source: IEA (10)
The Economist sums up the situation (note that this was prior to the Ukraine invasion) succinctly.
“Yet an underlying factor is expected to worsen the scarcity in the next few years: a slump in investment in oil wells, natural-gas hubs and coal mines. This is partly a hangover from the period of abundance, with years of overinvestment giving rise to more capital discipline. It is also the result of growing pressures to decarbonize. This year the investment shortfall is one of the main reasons prices of all three energy commodities have soared.” (6)
Green energy projects are taking up an increasing portion of the capital expenditures firms are making due to pressures to decarbonize. Investors and regulators are pushing for lower carbon projects (less focused on oil & gas). Unlike past cycles of high commodity prices, investors are demanding firms to pay out more of the profits in the form of dividends and stock buybacks rather than developing new oil & gas reserves. This has led to a dampened supply response that will likely elongate and exacerbate the commodity shortages. Even OPEC+ has shunned investment in new production because of government budget constraints and a concern over diversifying their economies away from hydrocarbons. The oil & gas industry faces a crisis of confidence in the long-term demand of their hydrocarbons resulting in underinvestment in developing the supplies necessary to ease the transition to a more sustainable and lower carbon emission future.
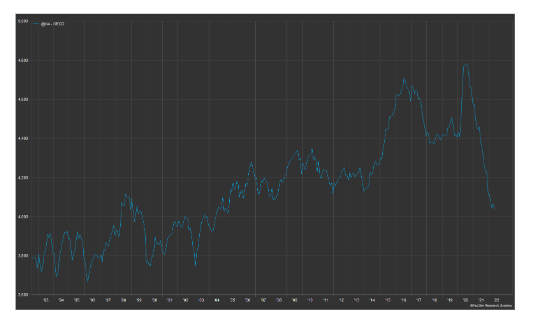
To illustrate the current situation, I have pulled some charts from FactSet, a data provider. Total oil stocks in OECD peaked in 2020 as demand plummeted during the pandemic. Producers began running out of storage and were forced to shut in wells which can be costly to restart. The supply response has been inadequate relative to the resurgence in demand causing total oil stocks to drop its lowest level since 2005.
EIA Total Petroleum Stocks - OECD (Developed Countries) (Millions of Barrels)
Source: FactSet Research Systems (11)
In the US, the Biden administration has been fighting high oil prices through releases from the strategic petroleum reserve which now sits at its lowest level since 1985 (12). These releases seem unlikely to continue through the coming winter meaning either a significant recession or newfound supply will be needed to balance the market. The Biden administration likely is seeking to merely create a stopgap while they lobby OPEC for supply increases, which have been largely unsuccessful thus far.
Source: Mobius Risk Group (12)
The US is quickly becoming a global powerhouse in the export of liquid natural gas. We have significant resources at a lower cost relative to the rest of the world. Even so, we are facing a supply crunch here at home due to an increase in exports combined and a muted supply response. In this chart, I plot natural gas rig counts (blue) against Henry Hub natural gas spot prices (yellow) and seasonally adjusted underground USA storage (pink). The volume of rigs at work has not increased to enough to offset the growth in domestic and export demand leading a depletion of storage and an increase in prices.
Source: FactSet Research Systems (11)
Further, the invasion of Ukraine has made the situation worse as Europe races to cut the Russian hydrocarbon cord. This situation has been well documented in the short term, but there are serious implications for long term supply of both oil and gas. Russia is the largest global exporter of oil and one of the largest producers making up roughly 11% of global supply. In the chart below, the blue line represents global oil production, the yellow line is Russia’s production and the pink line is Russia as a percentage of the total (right axis). Russian oil and gas production has been largely fueled by the assistance of western firms like Exxon Mobil, BP and Schlumberger. In the absence of western technology, Russia will struggle mightily to maintain current production levels. Complicating this is the challenge that much of Russia’s oil & gas infrastructure (including pipelines) sits on permafrost. As global warming causes melting, significant shifts in the ground will cause substantial challenges to maintain and repair that infrastructure creating a formidable cost to maintaining future Russian supply. In all likelihood, additional infrastructure will likely be needed in order to reroute this production as well to new buyers as Europe finds new suppliers.
Source: FactSet Research Systems (11)
These challenges are multiplied when we consider Russian gas. According to the IEA, Russia is the world’s second largest producer of natural gas (13) with over 27% of it exported via pipeline (210 bcm out of 762 bcm). A step further, roughly 74% (155 bcm out of 210 bcm) of natural gas exports out of Russia go to Europe (14). If Russia permanently halts natural gas exports to Europe, about 20% (155 bcm out of 762 bcm) will be gone from the market. This is because, for natural gas to be exported via ship, it must first be liquified. The infrastructure required to do so costs billions of dollars and takes years to develop. Russia is working hard to expand their LNG export capacity, but it will take years for those wells to reach the market again. In the meantime, Russia will be flaring (burning) the gas, storing what they can and likely shut wells in which will be costly to restart. In short, while the world is going to need more natural gas in the coming years, the 2nd largest producer will see significant declines in production.
Risks to this supply/demand dynamic do exist.
Europe will not be able to replace hydrocarbons from Europe in short order. While many LNG import facilities are being built on the continent, current capacity is not near sufficient, and they will be forced to consume less. In addition, the European oil & gas pipeline network is not capable of distributing enough to interior countries to replace what is lost from Russia.
A severe global recession could lead to significant demand destruction and cause oversupply in the near term, especially with oil.
The sentiment from investors and regulators could flip quickly to reward companies to increase production. This will take time to see supply come to fruition, but it is typical of past commodity cycles.
Geopolitical risk can work both ways: Supply disruptions have been felt in Libya, Iran, Venezuela, and Russia as of late. Those could get much worse, but a period of prolonged stability could free supply and balance the market.
Moats in the Oil & Gas Business
If you are regular reader, you’ll know we spend a lot of time thinking about sustainable competitive advantages aka “Moats” as a way to protect profits long term and reduce the risk of downside error in our valuation estimates. To learn more about economic moats in general, see our past articles here and here.
There are several examples of moats in the oil & gas business. In the downstream business, moats can be built through patented processes for developing specialty chemicals and plastics that allow for economic profits to be generated. The midstream part of the business tends to be extremely “moaty”. Building new pipelines has gotten harder and harder over the years as increasing regulation coupled with a less concentrated land ownership environment create higher hurdles for building new pipelines. This allows the owners of existing pipelines significant pricing power over their customers. Upstream firms build moats through producing oil & gas at a lower cost than their competitors. The best firms tend to have the most prolific assets and be ruthlessly efficient at extracting resources. Because these are asset-heavy businesses, it cannot be overstated how important a management team’s ability to make wise capital allocation decisions. Over a period of a decade or two, the investments a management team makes may become the majority of the business. A strong management team will invest the firm’s capital in a way that strengthens the company’s moat, ensuring the return on invested capital remains above their cost on average through the commodity cycle. When those opportunities are scarce, they should be returning capital back to shareholders through dividends and share repurchases.
A Look to the Future
As of this writing, most of our clients have significant exposure to the oil & gas business. We sold a small part of that investment for many clients earlier this year to manage the size of those investments relative to the overall portfolio, but we believe the opportunity set is still quite appealing. Gas, especially, should be resilient to changes coming from decarbonization. Oil will likely face a decline in demand at some point in the coming years but will remain an important input to the global economy. The investment prospects for the stocks should remain strong if the valuations don’t become frothy and/or upstream companies don’t start reaching for new capacity. What’s more, oil and gas companies should have opportunities in areas such as carbon capture and storage as well as green and blue hydrogen. For example, these companies have been pumping carbon dioxide into the ground as a method to increase the pressure (and production) of a well for decades. That know-how could prove useful in the future. Much of the natural gas infrastructure could be repurposed for hydrogen in the future, extending the life of those assets. While the demand for oil may wane at some point, I expect the commodity cycles have not been magically broken. For now, it appears the market underappreciates the supply/demand backdrop and the resiliency of those firms that have built sustainable competitive advantages.
Risks
Commodity markets such as oil & gas are very difficult to handicap. While I believe the future of these companies is bright due to supportive supply dynamics and long-term optionality, risks to this thesis could emerge. Supply could come on from new sources faster than anticipated. Demand could be permanently impaired due to an accelerated decarbonization trend and/or a worse than expected macroeconomic environment. Governments could penalize oil & gas companies through enhanced taxation or other means to help fund their policy objectives. While I attempt to capture risk within my valuation framework, the greatest risk is often in the unknown. It is possible there are holes in my thesis I have not yet found that could materially depress the intrinsic value of the industry. By the time you read this, our opinion may have changed. If you are a DIY investor, use this only as a starting point for your research and be sure to do your own due diligence.
Further Reading/Sources
Smead Capital Management - https://smeadcap.com/missives/buffett-jones-and-hamm-an-oil-wisdom-trifecta/ & https://smeadcap.com/missives/buffetts-buying-oil-stocks/ & https://smeadcap.com/missives/the-strategic-squeeze/
Oilprice.com https://oilprice.com/
JPMorgan Guide to the Markets - https://am.jpmorgan.com/us/en/asset-management/adv/insights/market-insights/guide-to-the-markets/
International Energy Agency - https://www.iea.org/
Seeking Alpha - https://seekingalpha.com/article/4414544-norways-oil-demand-data-is-cold-shower
The Economist – https://www.economist.com/finance-and-economics/the-age-of-fossil-fuel-abundance-is-dead/21805253
US Department of Energy SPR (Strategic Petroleum Reserve) - https://www.spr.doe.gov/dir/dir.html
McKinsey Global Energy Perspective 2022 - https://www.mckinsey.com/industries/oil-and-gas/our-insights/global-energy-perspective-2022
Goldman Sachs on energy prices and capital expenditures - https://www.goldmansachs.com/insights/pages/from-briefings-20-january-2022.html
International Energy Agency Charts - https://www.iea.org/data-and-statistics/charts?energy=gas%2Coil&topic=investment%2Ctransport&page=6
FactSet Research Systems
Mobius Risk Group – www.mobiusriskgroup.com
IEA on Russian oil & natural gas - https://www.iea.org/articles/energy-fact-sheet-why-does-russian-oil-and-gas-matter
IEA on Europe’s natural gas imports from Russia https://www.iea.org/news/how-europe-can-cut-natural-gas-imports-from-russia-significantly-within-a-year
University of Calgary - https://energyeducation.ca/encyclopedia/In_a_barrel_of_oil
International Energy Agency on natural gas - https://www.eia.gov/energyexplained/natural-gas/use-of-natural-gas.php
Securities Mentioned
For questions regarding our individual stock strategies, please reach out to us!
Invest Curiously,
Austin Crites, CFA
Austin Crites is the Chief Investment Officer of Aurora Financial Strategies, a financial advisory firm based out of Kokomo, IN. He can be reached via email at austin@auroramgt.com. Investment Advisory Services are offered through BCGM Wealth Management, LLC, a SEC registered investment adviser. This blog does not constitute advice. This is not an offer to buy or sell securities. Advisor is not licensed in all states. Any mention of a particular security and related performance data is not a recommendation to buy or sell that security. BCGM Wealth Management, LLC manages its clients’ accounts using a variety of investment techniques and strategies, which are not necessarily discussed in the commentary. Investments in securities involve the risk of loss. Past performance is no guarantee of future results. Clients may own positions in the securities discussed.


